


IELTS writing task: The line graph shows TV news viewing figures over a one-year period.
Write a report of at least 150 words summarizing the main features and making comparisons where relevant.
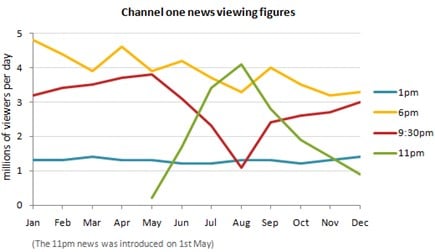
The line graph compares the viewership of Channel One news broadcasts at four different time slots throughout a year. The units are measured in millions of viewers per day.
Overall, for the majority of the period, view counts were the highest for the 6 p.m. broadcast, lowest but most stable for the 1 p.m. There was also a seasonal change mainly in summer, with viewership trending later in the day with the introduction of the 11 p.m. time slot, and 9:30 p.m. watching dropping temporarily.
Regarding the broadcasts at 1 p.m. and 6 p.m., the former had a consistent viewership at a little over a million. However, the 6 p.m. slot began the period at just under 5 million and then went into a period of downward fluctuation settling at just over 3 million in December.
As for the remaining time slots, there were nearly three million people watching the news at 9:30 p.m. in January, which increased gradually to just under 4 million in May. Over the subsequent three months, the numbers dropped to a low of about 1 million, before recovering to 2.5 million in September and then rising more gradually finishing at 3 million by the end of the year. Finally, on May 1st, the TV station added a fourth time slot for 11 p.m., whose figures skyrocketed to a peak of 4 million in August, after which they experienced a steep decline to nearly a million in December.