


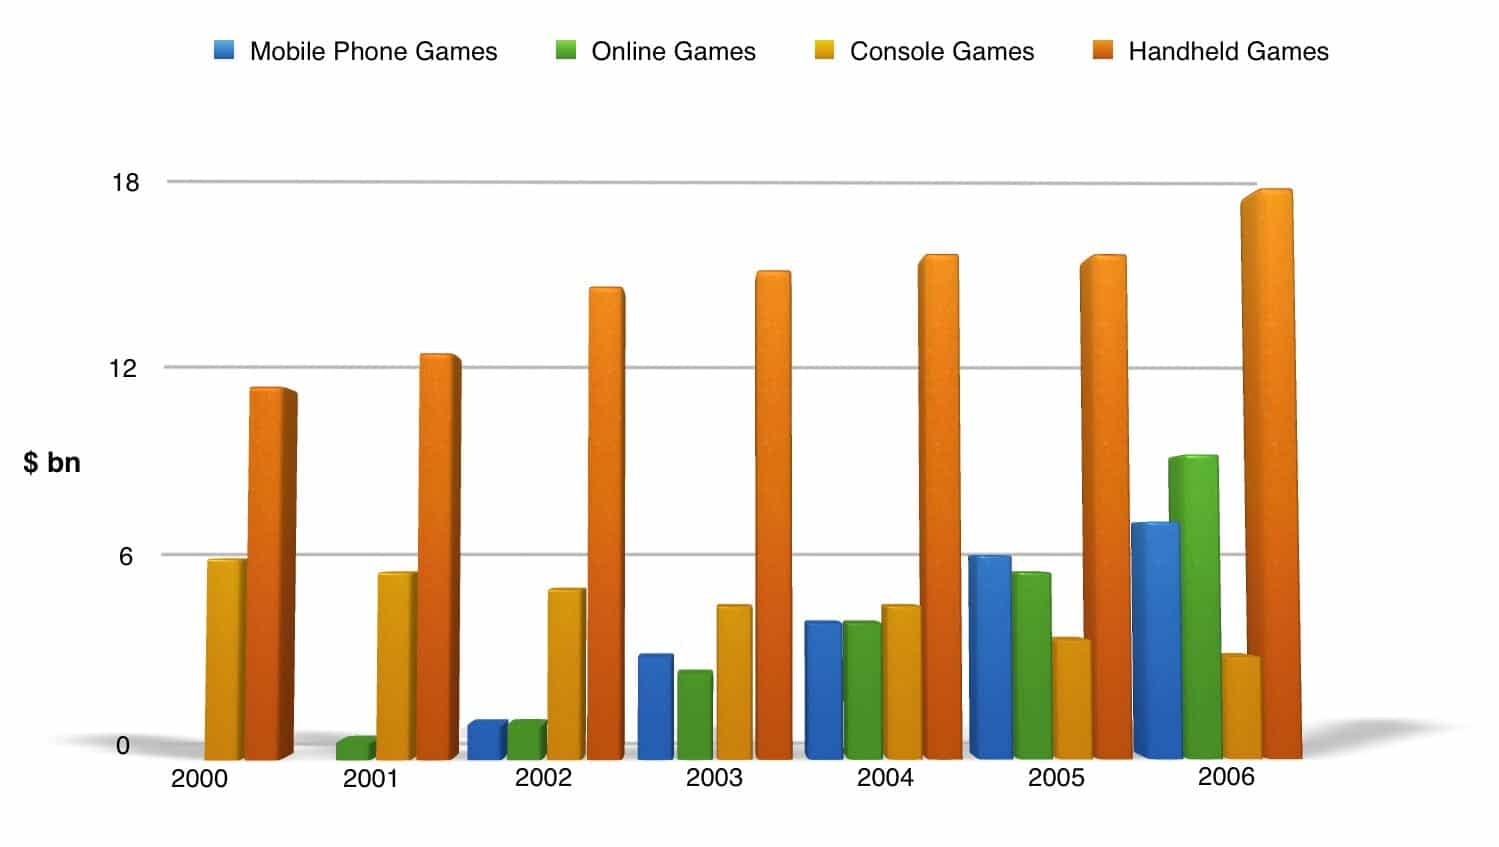
The bar graph shows the global sales (in billions of dollars) of different types of digital games between 2000 and 2006.
Summaries the information by selecting and reporting the main features, and make comparisons where revelant.
The bar chart compares the sales figures of four different types of gaming platforms (mobile phones, online, console, and handheld) sold worldwide from 2000 to 2006. The values are given in billion dollars.
Overall, handheld games were always the market leader with a turnover of at least twice as high as the second best-selling category of the year. Console games, meanwhile, continued losing their share of the market each year, whereas the figures for the other two categories continued to rise.
Regarding handheld and console games, the former were at the top with sales reaching just under $12 billion in the year 2000, while the corresponding figure for the latter was approximately half that amount. Over the next six years, sales of handheld games experienced a gradual increase and eventually stood at around $18 billion. However, those of console games declined over the same period and reached their lowest level (approximately $3 billion) in 2006.
In terms of online and mobile phone games, they were not very popular when they were introduced to markets (in 2001 and 2002 respectively) since their initial figures were under $3 billion. Nevertheless, both experienced a continual increase in their sales figures over the subsequent years. In 2006, the former became the second best-selling type of game with a turnover of around $9 billion, and the latter came next at about $7 billion.