


The graph and table below give information about water use worldwide and water consumption in two different countries.
Summaries the information by selecting and reporting the main features, and make comparisons where revelant.
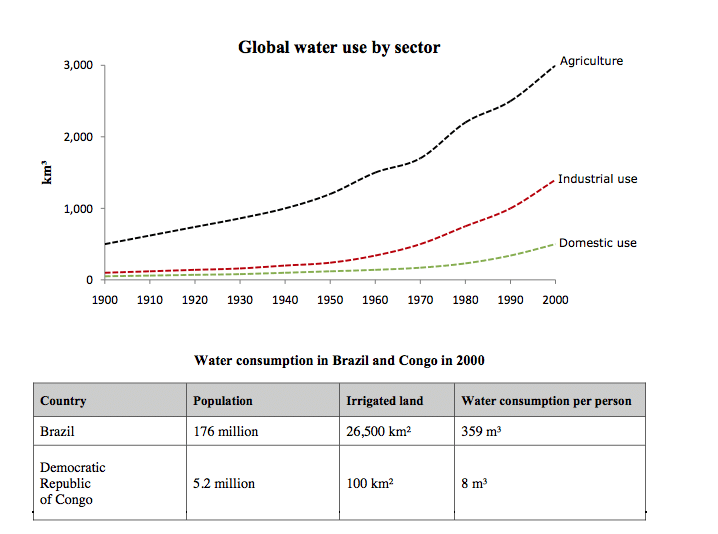
The line graph shows the global rate of water consumption by three sectors (agriculture, industry, and homes) in km³ between the years 1900 and 2000, and the table compares water usage per person, in cubic meters, in Brazil and the Democratic Republic of Congo in the year 2000.
Overall, the amount of water consumed globally by all the three sectors rose within the century with agriculture accounting for the largest portion of the water used. In addition, the figures for water consumption, population, and irrigated lands in Brazil were all significantly higher than those of Congo.
Regarding global water consumption, agriculture was responsible for about 500 km³ of water usage in 1900, while the corresponding figures for the other two sectors were reported to be at nearly one-fifth of that amount. Over the following 100 years, the consumption rate of water by agriculture rose steadily to 3000 km³, and the figures for industrial and domestic use increased gradually and stood at approximately 1000 km³ and 500 km³ respectively at the end of the period.
In terms of the figures for Brazil and Congo, the population of the former was at 176 million and that of the latter at 5.2 million. Moreover, Brazil had 265 times more irrigated land, which explains why the water consumption rate per person in it (359 m³) was almost 45 times higher than the figure for Congo.