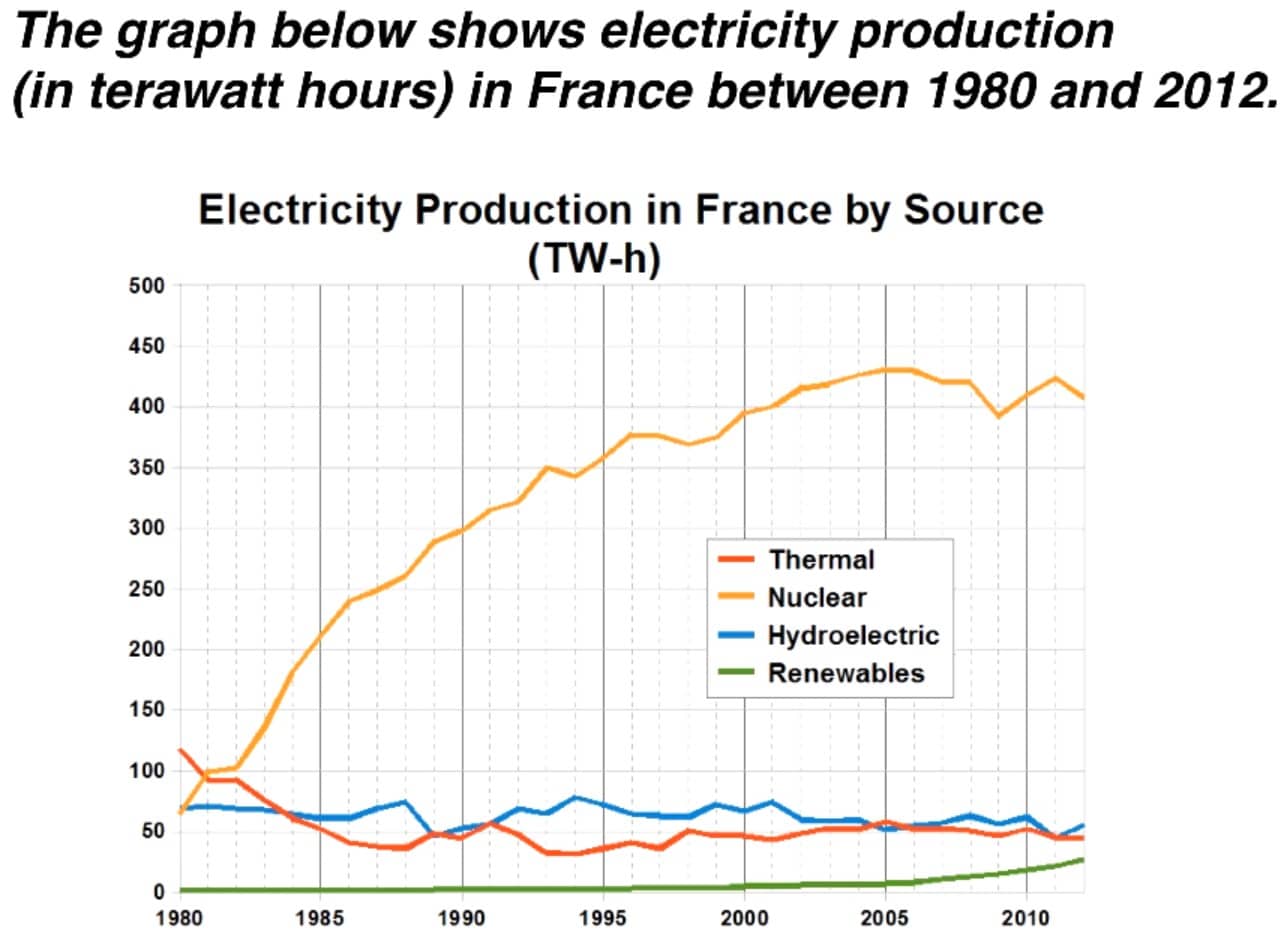
The graph shows electricity production (in terawatt hours) in France between 1980 and 2012.
Summarize the information by selecting and reporting the main features, and make comparisons where relevant.
The line graph compares the amount of electricity produced in France using thermal, nuclear, hydroelectric, and renewable sources from the year 1980 to 2012. The units are measured in terawatt hours.
Overall, nuclear power was by far the most popular means of energy production for most of the period, while renewables did not have a considerable share in the industry. Thermal and hydroelectric power plants, on the other hand, generated approximately equal amounts of electricity almost every year despite the fluctuations in their figures.
Regarding nuclear and thermal energy, the former was used to generate a little over 50 TW-h of electricity in 1980, while the corresponding figure for the latter was the highest among all the sources at just over 100 TW-h. However, they both had equal figures standing at about 100 TW-h a year later, after which nuclear power became the most common source and soared in popularity peaking at approximately 430 TW-h in 2005. Over the subsequent years, nuclear power generation experienced a downward fluctuation and settled at just over 400 TW-h. As for thermal power production, it continued losing its share in the energy industry gradually until 1988, but then started fluctuating at around 50 TW-h for the rest of the period.
In terms of the remaining two sources, hydroelectricity’s share did not change significantly over the years, remaining in the vicinity of 60 TW-h. Renewables, on the other hand, did not have any meaningful contribution to the energy industry until 2005, but over the following seven years, their figures rose steadily to 20 TW-h even though they were always the least common source.


