


In the first writing task of IELTS academic, you’re asked to describe a map, diagram, chart, or process within about 20 minutes. Therefore, it’s more of a report than an essay. In this guide, you’ll learn everything you need to know to write a high-quality report.
Frequently asked questions:
- Can I include my opinion?
Answer: No, you can’t. In the IELTS academic writing task 1, you’re required to describe what you see. This task assesses your ability to report on the topic in an impersonal way.
2. Should I have a conclusion at the end?
Answer: As I mentioned earlier, IELTS academic writing task 1 is not an essay. You need to write a report about the data. Therefore, you need to follow a different structure. Instead of a conclusion, you need to write an overview.
3. Where should I write the overview?
Answer: The overview is like a summary of all the data on the diagram. It’s the most important part of the report. Even though there’s no rule about where to write your overview, it is highly recommended to put it right after the introduction.
4. Can I spend less time on task 1 and more on task 2?
Answer: Yes, you can. However, you need to allocate enough time to understand the chart, identify the trends you want to discuss, write the report, and edit it.
Here are some quick tips and basic information:
- Look for patterns. You should also group the trends logically and compare them with the other group.
- You’re allowed to use numbers (e.g., 2, 125, and 300) and some signs (e.g., %, and $). You need to support your sentences with numbers from the chart and appropriate signs.
- Writing an overview is essential for getting a high band score, so make sure to write one before you start body paragraphs.
- In order to achieve a high band score, you need to mention something about all the categories.
Here’s the recommended structure for task 1:
Introduction:
Paraphrase the information that’s given about the diagram. Write that information in your own words. You also need to include certain information from the diagram, such as the names or number of the categories as well as the unit of measurement. That’s it!
Overview:
Identify the most important trends or data and briefly, in about two sentences, summarize the diagram. You can circle the important points, or you can take notes before you start writing. Whatever you write in the overview should be the summary of whatever you want to write in your body paragraphs. Make sure to use comparison where needed.
Note: Before you start writing your body paragraphs, I recommend that you separate the data into two groups. Being able to group the data logically is essential for high band scores.
Body paragraph 1:
Describe the items in group 1. You need to use comparison. Discuss the similarities, differences, or changes. If there is a chart with numbers, you need to include those as well. If you are describing a process, make sure you use the proper language. In our samples, you can see how you can do this.
Body paragraph 2:
Do the same thing as you did in body paragraph 1 but with the second group.
Note1: Make sure your word count is over 150 words. No conclusion is needed. Once you’ve written your report, review your work and correct the errors.
Note 2: Sometimes, there are too many numbers to include in the report. You don’t need to include all the numbers that you see. In such cases, IELTS wants to assess your ability to identify the most important data. However, for higher band scores, you need to mention something about each category. Being able to do this requires a lot of practice.
Note 3: Even though the paragraphing and structure are the same for all the question types, the language you need to use for each is different. For example, you need to use the words or phrases that describe a process for process diagrams. To describe numbers and their trends, you need to use words or phrases like increase, decrease, surge, downward trend, upward trends, etc. ESL Fluency’s IELTS writing task 1 vocabulary ebook will definitely help you learn the appropriate vocabulary items for these task types.
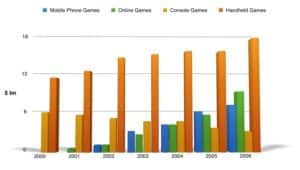
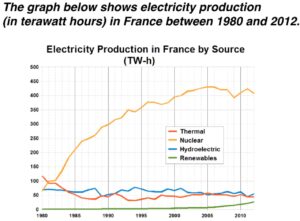
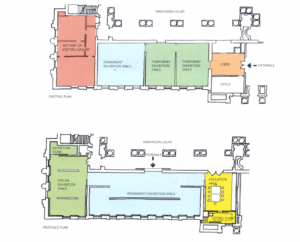
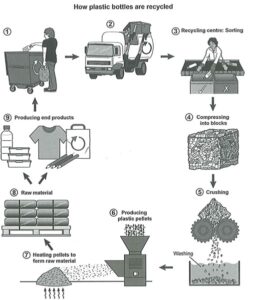
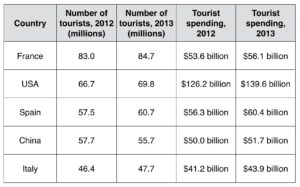
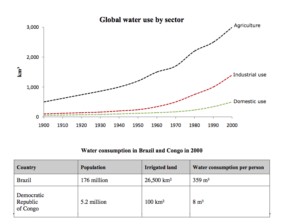
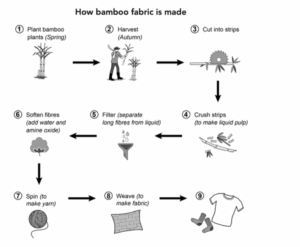
Here are the types of charts and diagrams you’ll see in the test. We’ve written a sample for each, so make sure to click on the images to read them.
All these diagrams are from the IELTS past papers: